Home
Climate Change
Energy Efficiency
Energy Policy
Renewable Energy
Research & Development
New Interactive Tools Provide More Information About Energy Commission Programs
New Interactive Tools Provide More Information About Energy Commission Programs

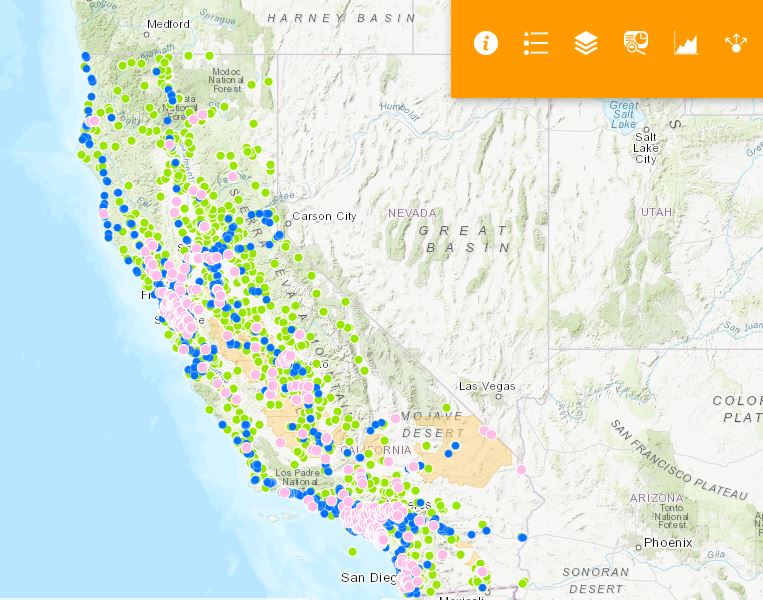
The California Energy Commission has launched two mapping tools that will help provide the public greater access and information about the programs that the agency invests in and supports.
The interactive tools are the Energy Commission Project Map and the Energy Commission Project Equity Dashboard.
The project map allows users to view the location of projects funded through programs such as the Electric Program Investment Charge (EPIC) program or the Alternative Renewable Fuels and Vehicle Technology Program (ARFVTP). EPIC funds clean energy innovations, strategies, and applications that help the state meet its energy and greenhouse gas emission reduction goals. ARFVTP invests in projects that accelerate the development and adoption of advanced clean transportation and fuel technology.
Clicking on an individual project point in the map offers a pop-up offering a wide range of data, such as the amount of money approved for the project or electricity and energy bill savings. In addition to Energy Commission programs, the map shows the location of power plants of various fuel types. Users can add layers showing low-income census tracts, disadvantaged communities, and the boundaries of legislative districts.
“We created this tool in order to convey the work that the Energy Commission does, and hope that it will improve the transparency and accessibility of this agency,” said Energy Commission Chair Robert B. Weisenmiller.
The dashboard tool shows the amount spent through various Energy Commission programs. Information offered includes how energy funds are distributed across low-income communities and/or disadvantaged communities.
The dashboard can also be filtered by county, Assembly district, and Senate district, showing all of the metrics for a particular region instead of the state overall.
The map and dashboard are examples of how the Energy Commission is making information more accessible to the public. Their release comes on the heels of the energy equity indicators report, which highlights opportunities for future investment in low-income or disadvantaged communities.
The mapping tools was Stanford University undergraduate Amulya Yerrapotu’s project during her summer internship with Chair Weisenmiller’s Office. The economics major was one of 12 students selected for Stanford Energy Internships in California/Colorado, an energy-related internship program for undergraduate and graduate students.
Related Posts
Research & Development


